Returns & risk
Constructed adjusted returns, arithmetic and geometric annualization, volatility, Sharpe ratios, and volatility drag.
FLAGSHIP QUANTITATIVE RESEARCH · 2026
Strategy backtesting, market-regime analysis, volatility persistence, and supervised forecasting under a leakage-aware out-of-sample protocol.
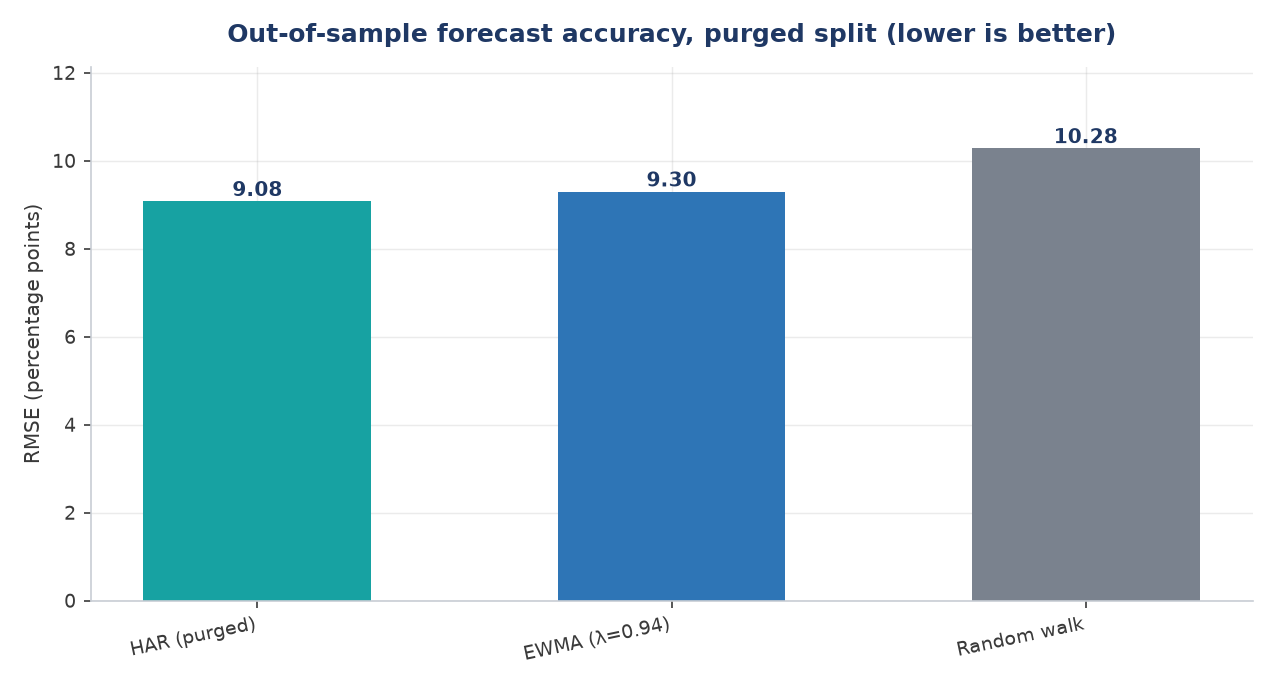
PURGED HOLDOUT · LOWER IS BETTER
Test period: May 2013–January 2016
The project began with returns and a simple trading rule, then followed the evidence toward a more defensible question. Directional returns showed little persistence; the magnitude of returns and realized volatility did.
Constructed adjusted returns, arithmetic and geometric annualization, volatility, Sharpe ratios, and volatility drag.
Tested a 20-day SMA rule with a one-period execution lag, turnover measurement, and costs from 0 to 100 basis points.
Measured rolling realized volatility and autocorrelation in returns, absolute returns, and volatility at multiple horizons.
Compared random walk, historical mean, EWMA, and HAR forecasts against a genuinely forward-looking target.
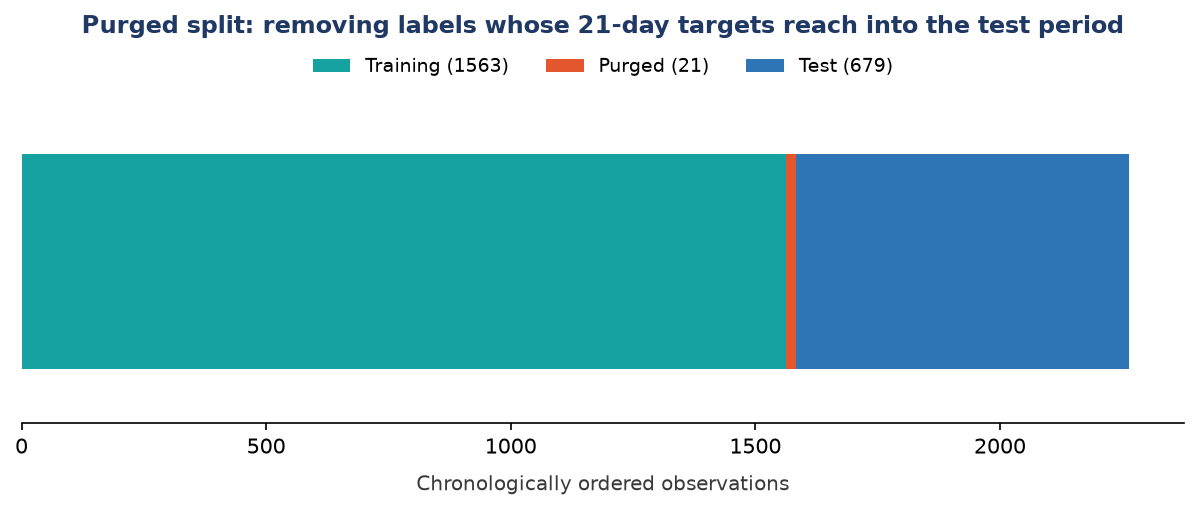
Used a chronological 70/30 split and purged 21 training labels whose target windows reached into the test period.
Encoded methodological safeguards as 15 tests covering timing, leakage, alignment, solver agreement, and reproducibility.
Look-ahead bias, overlapping evaluation targets, and split-boundary leakage each made a result appear stronger than it was.
STRATEGY ROBUSTNESS · 2007–2016
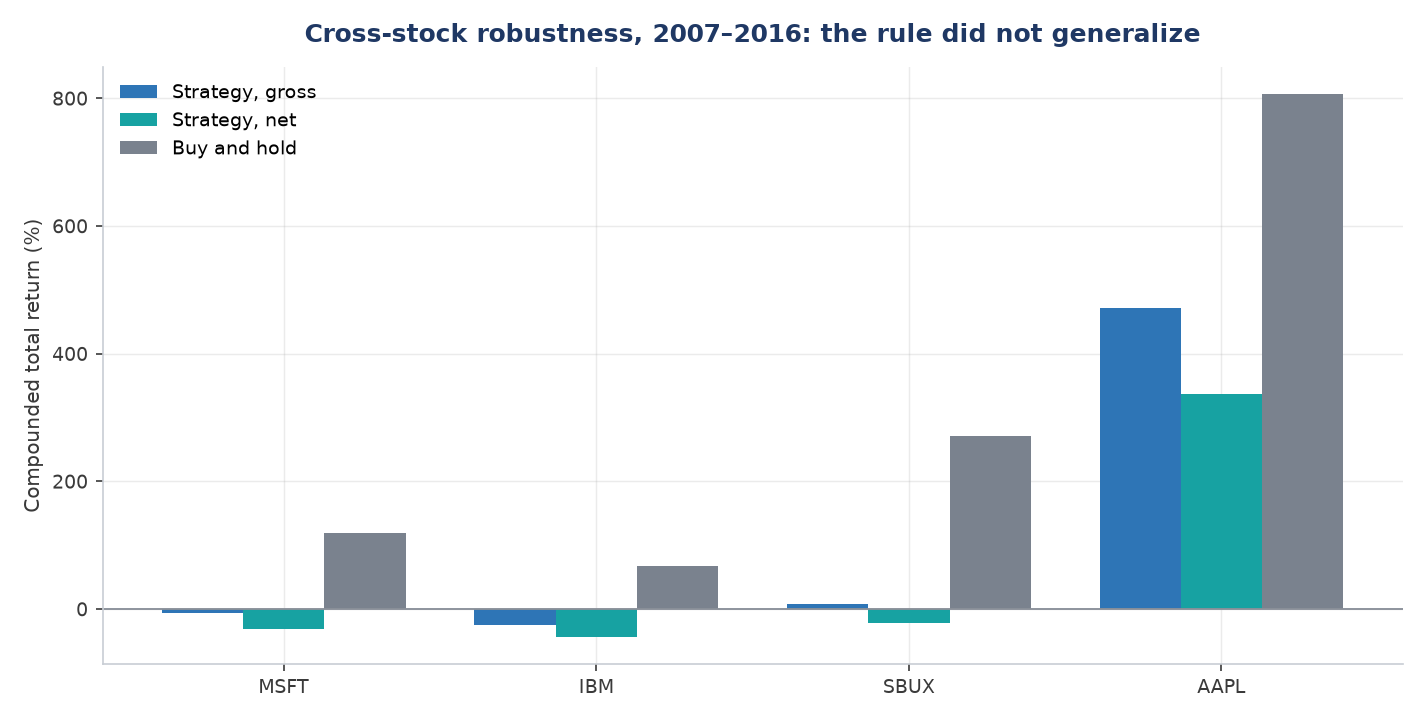
The net long-only SMA rule underperformed buy-and-hold across MSFT, IBM, SBUX, and AAPL. It lost money on three names. That null result matters: the rule did not generalize.
TARGET INTEGRITY
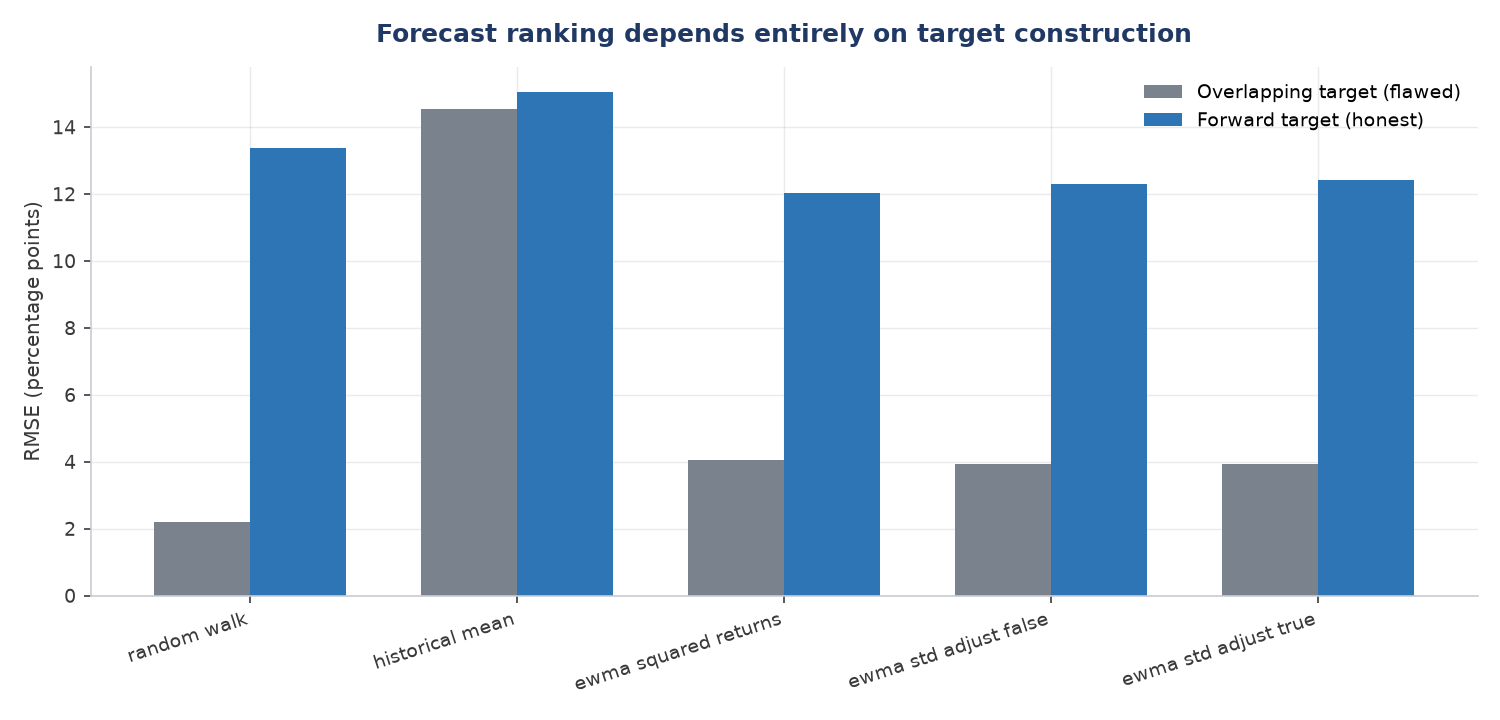
An overlapping answer key made the random walk look dominant because consecutive 21-day windows shared 20 observations. Using the next non-overlapping window reversed the ranking and made EWMA the best baseline.
PURGED HOLDOUT
The unpurged HAR result was 9.03%. Removing 21 boundary labels that reached into the test period raised RMSE to 9.08%. The corrected figure still beat EWMA by 2.34% and the random walk by 11.70%.
The project turns methodological claims into executable checks so a reviewer can test them rather than take them on trust.
The repository preserves the development path while providing a modular, tested implementation for reviewers who want production-style structure.
RESEARCH WALKTHROUGH
A single guided script preserves how the analysis progressed from first principles through the final forecasting experiment.
MODULAR PACKAGE
Separate modules for data, returns, strategy logic, volatility, forecasting, and figures reproduce the same results.
INTEGRITY SUITE
Tests verify timing, target construction, purging, alignment, numerical agreement, annualization, and deterministic reproduction.